提高雅思写作的方法论介绍
克服这5点,提高雅思写作的方法论介绍,一起来学习一下吧。下面小编就和大家分享,来欣赏一下吧。
克服这5点,提高雅思写作的方法论介绍
提高雅思写作的五种实用方法如下:
第一、很多学生语法基础薄弱,甚至没有语法概念。在高级阶段的教学中,我告诉很多学生,不管你们现在怎么写,写什么样的话题注定超不过6分,因为从第一句到最后一句都基本大大小小都有点文法错误,更谈不上地道不地道,是否有逻辑,有新观点了。因此在写作的初期准备中,语法是重点。不要相信一些所谓的抛开语法就可以学好英语的观点,因为我们的环境不具备语言习得的条件。语法是语言的一般规律,是掌握语言的捷径,而不是包袱。在语法学习中应该抓住要问题,比如名词主要是数和格的问题,动词主要是动词词性变化问题,因为它涉及到时态、语态、虚拟语气等的使用。很多学生能写出MAKED这样的变形来,让人哭笑不得。在选择语法教材的时候必须把握住简明实用的原则。复杂的语法书不适用于我们短期内掌握语法并将其应用于写作中,所以不建议同学看薄冰,张道真等语法专家编著的大部头著作。
第二、很多同学在学习英语中很少进行精读学习。读与写紧密相连。能写出多少东西决定于你读过多少东西,这同我们汉语写作是一样的。然而,雅思阅读侧重于技巧,因此雅思阅读的复习对于写作的帮助甚微,所以建议备考时间充足的同学每天坚持进行精读,养成查词典的好习惯,搞清楚一些词语的用法,并摘录一些典型用法以备日后使用。最好把一些好的词语的用法和一些优美的句子专门辑录下来。比如,我们在准备写作TASK 1图表作文时,就可以查找一些涉及数据表达,增减表达的文章。这类文章常见于经济类报刊,如英国的金融时报。于是我们既可以在网上搜索相关文章进行阅读,也可以在一些英美报刊选读的书籍中寻找相关内容。看到涉及增减变化,起伏趋势的句子就摘下来,以后必定可以用在写作中,而且表达会更自然更地道。
第三、话题相关词汇与表达匮乏。雅思写作TASK 1主要涉及图表描述语言,因此相关的词语必须熟记。而且表达同一概念的时候应该有多种方式,换词,换词性。TASK 2涉及到除了政治宗教等差不多方方面面,于是涉及相关的一些热门话题诸如教育,环境,文化等词语和表达必须知道。比如关于环境方面的,全球气候变暖怎么说,温室气体怎么说,二氧化碳怎么说,海平面上升怎么说。因为这些都是你在表达观点进行陈述时必须用到词语。因此早早进行分类记忆,对于后期写作大有帮助。
第四、同学在写作中一味追求模板范文。每次改作文,十个学生有九个一开头都是“With the development of”。模板不是不可以用,起码用得灵活些。要知道这些模板不是外国人给我们的,很多是我们中国人自己发明的,语言是否地道,结构是否为考官所喜欢还要打上一个大大的问号?我在给学生印发的一些由外国人写的例子中,几乎看不到模板的影子。没有几个人会按照那样的方式来安排文章。说白了,模板就是八股文,核心就是起承转合。很多范文质量并不高,即便是得7分的作文也不一定值得我们学习。这些文章多出于中国学生和教师之手,质量值得商榷。所以我们学习的时候就学的这样文章,然后再打个折扣,到自己写出来的就更不成样子了。
第五、刻意追求大词长句。有的同学背了一些大词,不管对它的语境使用是否清楚,一概往作文里用。也有的同学满篇都是长难句,句子一长,结构一复杂就到处是语病。其实这都是误区。雅思作文要求用词零活多样,句型多变,但这不意味着必须使用大词,难词,长句,复杂句。简单词语的灵活使用也可满足要求。比如我们要表达满足需求,同学们都查满足该怎么说,需求该怎么说,其实很简单的“answer the need of”就可以使用,但是没有人知道answer还有满足的意思。其实我们写作中最合适的是长短句交叉使用。这样文章会更加易读,更加流畅。英语也一直在发展。我们读当代的英语小说和一些文章,多数都是流畅通顺易懂的,和我们读维多利亚时代的小说感觉大不相同。更何况,很多同学语法造诣远远不够,干嘛盲目追求句子的长与复杂而暴露更多语病呢。国外这些年都在流行“plain English”(简明英语运动),所以我们也应该以准确和流畅作为写作的基本要求。平时多做句子练习,写好简单句,写好一般的复合句。
以上就是克服这5点,提高雅思写作的方法论介绍的全部内容,其中第一至第三点是写出一篇雅思作文必须要克服的问题,觉得自己基础还需要加强的同学可以先做到第一至第三点。第四和第五点是写好一篇高分雅思作文要克服的问题,对于基础较好同学,可以参考以上方法提高雅思写作。
雅思小作文混合图范文之英国移民变化
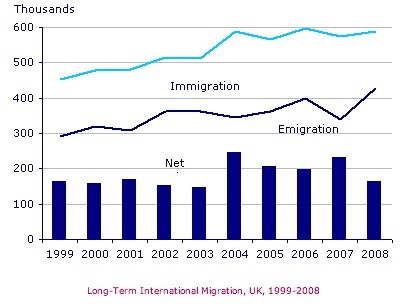
The chart below shows long-term international migration in UK..Write at least 150 Words.
图表展示1999-2008年的10年间英国移民数量的变化情况。请写一篇150字以上的报告。
雅思图表小作文混合图(线图+饼图)9分范文:
The chart gives information about UK immigration, emigration and net migration between 1999 and 2008.(1句做介绍导入)
Both immigration and emigration rates rose over the period shown, but the figures for immigration were significantly higher. Net migration peaked in 2004 and 2007.(2句做图表概述)
In 1999, over 450,000 people came to live in the UK, while the number of people who emigrated stood at just under 300,000. The figure for net migration was around 160,000, and it remained at a similar level until 2003. From 1999 to 2004, the immigration rate rose by nearly 150,000 people, but there was a much smaller rise in emigration. Net migration peaked at almost 250,000 people in 2004.(3句的细节段1)
After 2004, the rate of immigration remained high, but the number of people emigrating fluctuated. Emigration fell suddenly in 2007, before peaking at about 420,000 people in 2008. As a result, the net migration figure rose to around 240,000 in 2007, but fell back to around 160,000 in 2008.(3句的细节段2)(159)
雅思小作文之年垃圾产量
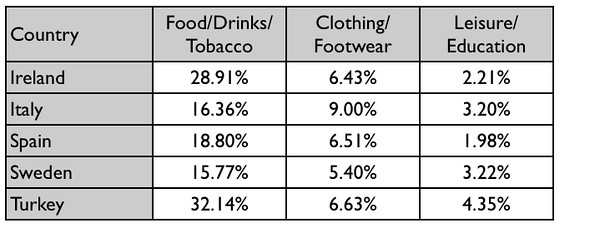
The table below gives information on consumer spending on different items in five different countries in 2002.
该表格展示5国在不同品类商品上的消费金额(饮食,服饰,休闲教育)。请作答。
雅思图表小作文表格题型9分范文:
The table shows percentages of consumer expenditure for three categories of products and services in five countries in 2002.
It is clear that the largest proportion of consumer spending in each country went on food, drinks and tobacco. On the other hand, the leisure/education category has the lowest percentages in the table.
Out of the five countries, consumer spending on food, drinks and tobacco was noticeably higher in Turkey, at 32.14%, and Ireland, at nearly 29%. The proportion of spending on leisure and education was also highest in Turkey, at 4.35%, while expenditure on clothing and footwear was significantly higher in Italy, at 9%, than in any of the other countries.
It can be seen that Sweden had the lowest percentages of national consumer expenditure for food/drinks/tobacco and for clothing/footwear, at nearly 16% and just over 5% respectively. Spain had slightly higher figures for these categories, but the lowest figure for leisure/education, at only 1.98%.(155)
雅思小作文表格题范文之骑行上班
The table below gives information on consumer spending on different items in five different countries in 2002.
该表格展示5国在不同品类商品上的消费金额(饮食,服饰,休闲教育)。请作答。
雅思图表小作文表格题型9分范文:
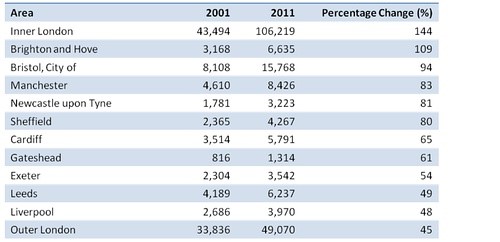
The table shows percentages of consumer expenditure for three categories of products and services in five countries in 2002.
It is clear that the largest proportion of consumer spending in each country went on food, drinks and tobacco. On the other hand, the leisure/education category has the lowest percentages in the table.
Out of the five countries, consumer spending on food, drinks and tobacco was noticeably higher in Turkey, at 32.14%, and Ireland, at nearly 29%. The proportion of spending on leisure and education was also highest in Turkey, at 4.35%, while expenditure on clothing and footwear was significantly higher in Italy, at 9%, than in any of the other countries.
It can be seen that Sweden had the lowest percentages of national consumer expenditure for food/drinks/tobacco and for clothing/footwear, at nearly 16% and just over 5% respectively. Spain had slightly higher figures for these categories, but the lowest figure for leisure/education, at only 1.98%.(155)
提高雅思写作的方法论介绍相关文章:
提高雅思写作的方法论介绍
上一篇:实例解析雅思大作文思路展开方法
下一篇:雅思小白和老手的雅思写作提高方法

